A new workspace for particle physics
Developed with academic guidance.
- LO (Born)
- NLO
Thank you — you're on the list.
Calculations
Explore cross sections and distributions from recorded calculations.
Calculation method
LO
Tree-level prediction
Leading-order cross section
Data and calculation details
This recorded calculation has not yet been validated for publication. Here, LO means the Born contribution evaluated with the same PDF set as NLO.
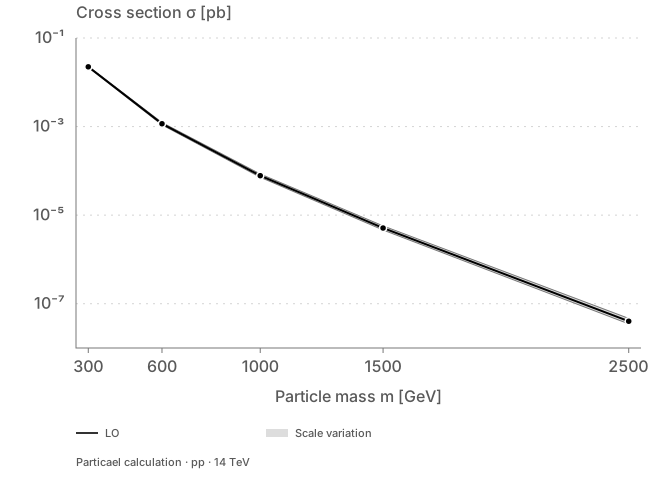
The tree-level cross section across the particle mass scan.
The production cross section falls across the particle mass scan. A tree-level calculation supplies the baseline against which radiative corrections are compared.
The shaded region follows the seven-point scale variation at each calculated mass. Both the absolute rate and its scale dependence belong to the specified process and setup.
- Collision
- pp · 14 TeV
- Mass scan
- 300–2500 GeV
- CT18NNLO
- Scales
- μR = μF = Mpair
This example uses the shared fixed-order setup. Scale and PDF uncertainty are distinct; no PDF or Monte Carlo integration uncertainty is included in these bands. Connecting segments guide the eye.
Particael calculation
| Mass [GeV] | LO [pb] | LO scale min [pb] | LO scale max [pb] | NLO [pb] | NLO scale min [pb] | NLO scale max [pb] |
|---|---|---|---|---|---|---|
| 300 | 0.0223411 | 0.02174404 | 0.02293911 | 0.026546633 | 0.026187924 | 0.026949086 |
| 600 | 0.0011577986 | 0.0010922919 | 0.0012304096 | 0.0014217842 | 0.0013887054 | 0.0014538487 |
| 1000 | 7.7774148e-05 | 7.1637334e-05 | 8.4826843e-05 | 9.8257854e-05 | 9.50051e-05 | 0.00010129836 |
| 1500 | 5.1161499e-06 | 4.6120172e-06 | 5.7104542e-06 | 6.6995559e-06 | 6.4080702e-06 | 6.9706241e-06 |
| 2500 | 4.0191048e-08 | 3.500969e-08 | 4.6524205e-08 | 5.6636245e-08 | 5.3094488e-08 | 5.9989013e-08 |
Scale dependence at leading order
Data and calculation details
This recorded calculation has not yet been validated for publication. Here, LO means the Born contribution evaluated with the same PDF set as NLO.
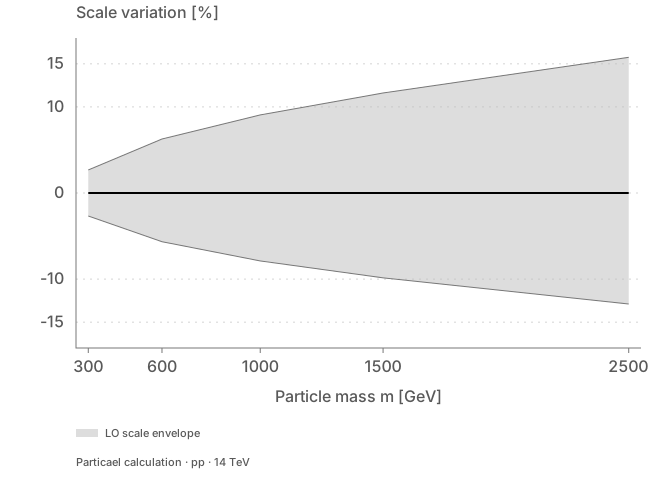
Varying the renormalisation and factorisation scales probes the dependence on unphysical scale choices at a fixed perturbative order.
The envelope is expressed relative to the central cross section at each mass, so the change in sensitivity can be compared along the scan.
- Collision
- pp · 14 TeV
- Mass scan
- 300–2500 GeV
- CT18NNLO
- Scales
- μR = μF = Mpair
This example uses the shared fixed-order setup. Scale and PDF uncertainty are distinct; no PDF or Monte Carlo integration uncertainty is included in these bands. Connecting segments guide the eye.
Particael calculation
| Mass [GeV] | LO min [%] | LO max [%] | NLO min [%] | NLO max [%] |
|---|---|---|---|---|
| 300 | -2.6724736 | 2.6767259 | -1.351241 | 1.5160228 |
| 600 | -5.6578666 | 6.2714707 | -2.3265697 | 2.2552297 |
| 1000 | -7.8905577 | 9.0681739 | -3.3104265 | 3.0944152 |
| 1500 | -9.8537515 | 11.616241 | -4.3508212 | 4.0460622 |
| 2500 | -12.891821 | 15.757631 | -6.2535166 | 5.9198275 |
Calculation method
NLO
Virtual and real-emission QCD
NLO / LO ratio
Data and calculation details
This recorded calculation has not yet been validated for publication. Here, LO means the Born contribution evaluated with the same PDF set as NLO.
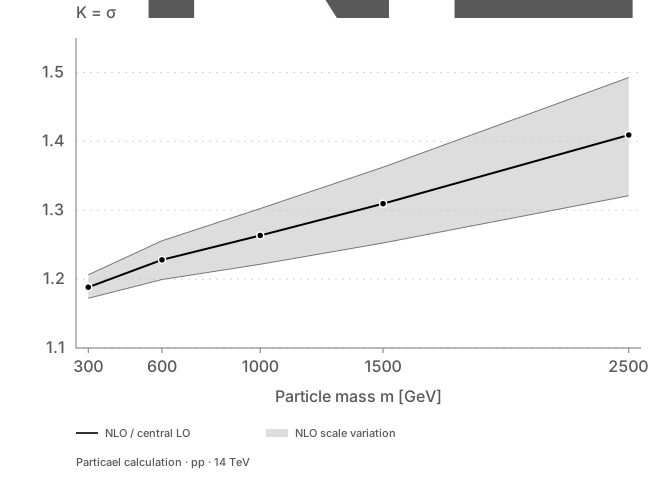
The K-factor expresses the NLO cross section as a ratio to the central LO result. Across this scan, it rises from 1.188 at 300 GeV to 1.409 at 2500 GeV.
The denominator is fixed when constructing the band. This isolates NLO scale variation and avoids treating two independently varied predictions as one uncertainty.
- Collision
- pp · 14 TeV
- Mass scan
- 300–2500 GeV
- CT18NNLO
- Scales
- μR = μF = Mpair
This example uses the shared fixed-order setup. Scale and PDF uncertainty are distinct; no PDF or Monte Carlo integration uncertainty is included in these bands. Connecting segments guide the eye.
Particael calculation
| Mass [GeV] | K | NLO scale min / LO | NLO scale max / LO |
|---|---|---|---|
| 300 | 1.188242 | 1.172186 | 1.206256 |
| 600 | 1.2280065 | 1.1994361 | 1.2557009 |
| 1000 | 1.2633742 | 1.2215512 | 1.3024683 |
| 1500 | 1.3094917 | 1.2525181 | 1.3624746 |
| 2500 | 1.4091756 | 1.3210526 | 1.4925964 |
NLO cross section
Data and calculation details
This recorded calculation has not yet been validated for publication. Here, LO means the Born contribution evaluated with the same PDF set as NLO.
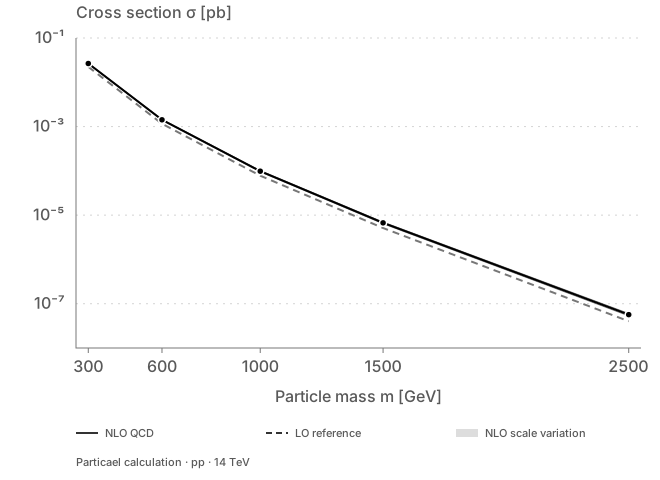
NLO and Born predictions from the same calculation setup.
Virtual and real-emission QCD contributions modify the leading-order prediction. Here the NLO rate is compared with the Born contribution from the same calculation setup.
The solid curve carries the NLO scale envelope; the dashed curve is the LO reference. A narrower scale band is one diagnostic of perturbative stability, not a complete uncertainty estimate.
- Collision
- pp · 14 TeV
- Mass scan
- 300–2500 GeV
- CT18NNLO
- Scales
- μR = μF = Mpair
This example uses the shared fixed-order setup. Scale and PDF uncertainty are distinct; no PDF or Monte Carlo integration uncertainty is included in these bands. Connecting segments guide the eye.
Particael calculation
| Mass [GeV] | LO [pb] | LO scale min [pb] | LO scale max [pb] | NLO [pb] | NLO scale min [pb] | NLO scale max [pb] |
|---|---|---|---|---|---|---|
| 300 | 0.0223411 | 0.02174404 | 0.02293911 | 0.026546633 | 0.026187924 | 0.026949086 |
| 600 | 0.0011577986 | 0.0010922919 | 0.0012304096 | 0.0014217842 | 0.0013887054 | 0.0014538487 |
| 1000 | 7.7774148e-05 | 7.1637334e-05 | 8.4826843e-05 | 9.8257854e-05 | 9.50051e-05 | 0.00010129836 |
| 1500 | 5.1161499e-06 | 4.6120172e-06 | 5.7104542e-06 | 6.6995559e-06 | 6.4080702e-06 | 6.9706241e-06 |
| 2500 | 4.0191048e-08 | 3.500969e-08 | 4.6524205e-08 | 5.6636245e-08 | 5.3094488e-08 | 5.9989013e-08 |
LO and NLO scale dependence
Data and calculation details
This recorded calculation has not yet been validated for publication. Here, LO means the Born contribution evaluated with the same PDF set as NLO.
The two envelopes use the same mass points and scale-variation prescription. Each is normalised to its own central cross section.
In this scan, the NLO scale envelope is narrower at every mass point. This comparison shows the remaining scale dependence; PDF and numerical integration uncertainties must be considered separately.
- Collision
- pp · 14 TeV
- Mass scan
- 300–2500 GeV
- CT18NNLO
- Scales
- μR = μF = Mpair
This example uses the shared fixed-order setup. Scale and PDF uncertainty are distinct; no PDF or Monte Carlo integration uncertainty is included in these bands. Connecting segments guide the eye.
Particael calculation
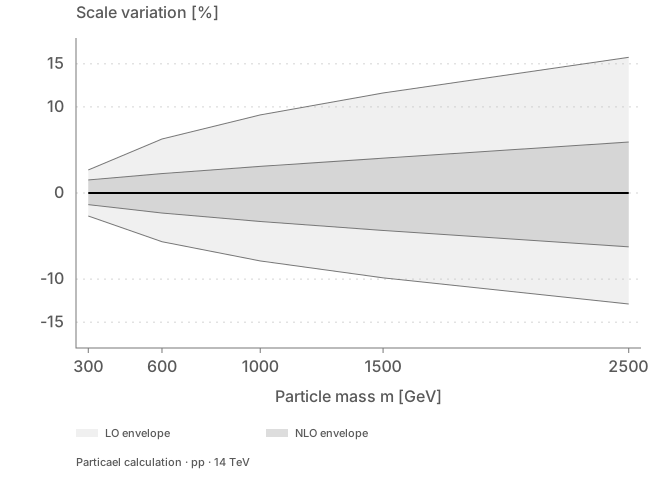
| Mass [GeV] | LO min [%] | LO max [%] | NLO min [%] | NLO max [%] |
|---|---|---|---|---|
| 300 | -2.6724736 | 2.6767259 | -1.351241 | 1.5160228 |
| 600 | -5.6578666 | 6.2714707 | -2.3265697 | 2.2552297 |
| 1000 | -7.8905577 | 9.0681739 | -3.3104265 | 3.0944152 |
| 1500 | -9.8537515 | 11.616241 | -4.3508212 | 4.0460622 |
| 2500 | -12.891821 | 15.757631 | -6.2535166 | 5.9198275 |
Calculation method
NLO+PS
Matched parton shower
Pair transverse momentum
Data and calculation details
The 3D view shows the main histogram. Switch to 2D to see the relative MC uncertainty and the AUX diagnostic panel as well.
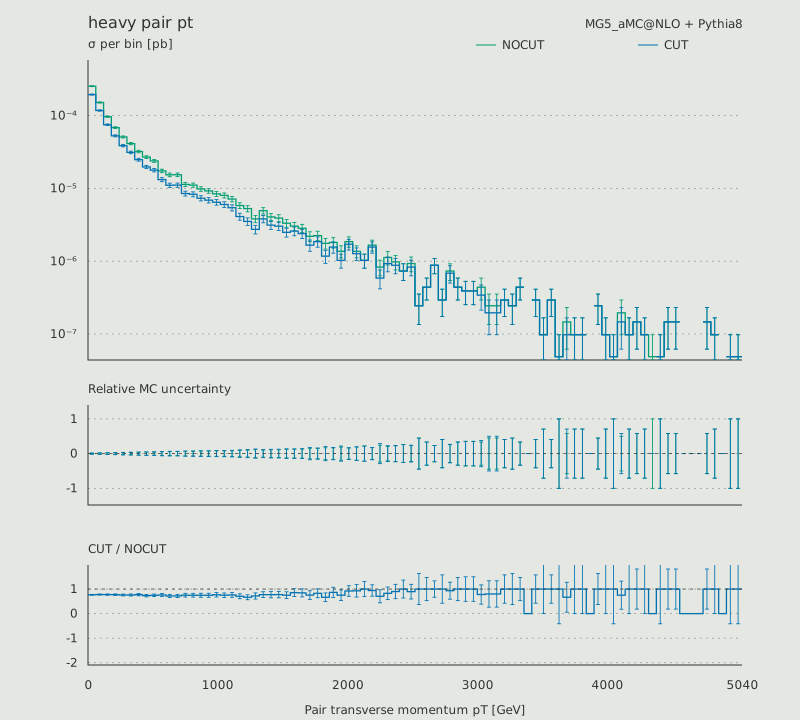
The original simulation bins, with two selections and Monte Carlo errors.
- Collision
- pp · 100 TeV
- Particle mass
- 1800 GeV
- Bin width
- 60 GeV
- Uncertainty
- Monte Carlo integration error
The histogram preserves the individual bins produced by the event simulation. Inspect the tail, compare the two selections, or switch to the flat figure for the original three-panel arrangement.
This figure was redrawn from the recorded MG5 HwU output and its gnuplot instructions. The 2D view preserves the histogram steps, axis ranges, per-bin units, MC errors and CUT/NOCUT ratio, with typography adapted to the site. It is a rendering of the calculation data, rather than an image exported by MG5.
The 3D view displays the main cross-section panel. Depth separates the two selections; it is not an additional physical observable. The 2D figure also shows relative MC uncertainties and the ratio stored in the AUX histogram. Zero bins are retained in this table and appear as gaps on the logarithmic axis. Error bars are clipped at the plot limits.
| Bin min [GeV] | Bin max [GeV] | NOCUT [pb/bin] | NOCUT MC error [pb/bin] | CUT [pb/bin] | CUT MC error [pb/bin] | CUT/NOCUT | CUT/NOCUT error |
|---|---|---|---|---|---|---|---|
| 0 | 60 | 0.000252721 | 3.585215e-06 | 0.0001939089 | 3.130864e-06 | 0.76728448 | 0.016491273 |
| 60 | 120 | 0.0001510567 | 2.83877e-06 | 0.0001172824 | 2.491054e-06 | 0.7764131 | 0.022019164 |
| 120 | 180 | 9.644199e-05 | 2.253579e-06 | 7.467421e-05 | 1.980132e-06 | 0.77429147 | 0.027366295 |
| 180 | 240 | 6.828054e-05 | 1.90846e-06 | 5.26136e-05 | 1.675143e-06 | 0.77055044 | 0.032645468 |
| 240 | 300 | 5.080775e-05 | 1.631195e-06 | 3.855727e-05 | 1.426291e-06 | 0.7588856 | 0.03717081 |
| 300 | 360 | 4.114403e-05 | 1.474737e-06 | 3.118747e-05 | 1.284831e-06 | 0.75800718 | 0.041392576 |
| 360 | 420 | 3.201718e-05 | 1.283903e-06 | 2.474498e-05 | 1.13101e-06 | 0.77286569 | 0.046993429 |
| 420 | 480 | 2.684367e-05 | 1.177445e-06 | 1.966909e-05 | 1.00854e-06 | 0.73272731 | 0.04944216 |
| 480 | 540 | 2.381766e-05 | 1.097879e-06 | 1.776563e-05 | 9.489102e-07 | 0.74590157 | 0.052625354 |
| 540 | 600 | 1.737518e-05 | 9.6138e-07 | 1.31778e-05 | 8.397018e-07 | 0.75842668 | 0.064004377 |
| 600 | 660 | 1.53253e-05 | 8.812275e-07 | 1.103031e-05 | 7.497824e-07 | 0.71974513 | 0.064081513 |
| 660 | 720 | 1.53741e-05 | 8.771634e-07 | 1.107912e-05 | 7.481922e-07 | 0.72063535 | 0.063709075 |
| 720 | 780 | 1.132315e-05 | 7.465986e-07 | 8.492361e-06 | 6.474937e-07 | 0.74999987 | 0.075600165 |
| 780 | 840 | 1.107912e-05 | 7.450016e-07 | 8.297135e-06 | 6.474937e-07 | 0.74889838 | 0.077146301 |
| 840 | 900 | 9.810142e-06 | 7.022058e-07 | 7.321001e-06 | 6.056749e-07 | 0.74626861 | 0.081640832 |
| 900 | 960 | 9.224462e-06 | 6.709808e-07 | 6.881741e-06 | 5.795472e-07 | 0.74603169 | 0.083018292 |
| 960 | 1020 | 8.394748e-06 | 6.438043e-07 | 6.442481e-06 | 5.649781e-07 | 0.76744186 | 0.089406483 |
| 1020 | 1080 | 8.004295e-06 | 6.250304e-07 | 6.003221e-06 | 5.412922e-07 | 0.74999997 | 0.089459754 |
| 1080 | 1140 | 7.125775e-06 | 5.937588e-07 | 5.417541e-06 | 5.188221e-07 | 0.76027394 | 0.096511301 |
| 1140 | 1200 | 5.807994e-06 | 5.32418e-07 | 4.099761e-06 | 4.473206e-07 | 0.70588244 | 0.10059289 |
| 1200 | 1260 | 5.271121e-06 | 5.072138e-07 | 3.514081e-06 | 4.141384e-07 | 0.66666673 | 0.10143011 |
| 1260 | 1320 | 3.806921e-06 | 4.310489e-07 | 2.733174e-06 | 3.652357e-07 | 0.7179487 | 0.12574898 |
| 1320 | 1380 | 4.929474e-06 | 5.001196e-07 | 3.806921e-06 | 4.419632e-07 | 0.77227733 | 0.11906873 |
| 1380 | 1440 | 4.050954e-06 | 4.4465e-07 | 3.123627e-06 | 3.904534e-07 | 0.77108429 | 0.1282719 |
| 1440 | 1500 | 3.904534e-06 | 4.365402e-07 | 3.026014e-06 | 3.843041e-07 | 0.77500004 | 0.1311309 |
| 1500 | 1560 | 3.318854e-06 | 4.024702e-07 | 2.48914e-06 | 3.485494e-07 | 0.74999985 | 0.13892973 |
| 1560 | 1620 | 3.026014e-06 | 3.843041e-07 | 2.586754e-06 | 3.55318e-07 | 0.85483874 | 0.15991872 |
| 1620 | 1680 | 2.830787e-06 | 3.717006e-07 | 2.391527e-06 | 3.416467e-07 | 0.8448276 | 0.16392605 |
| 1680 | 1740 | 2.1963e-06 | 3.346017e-07 | 1.659427e-06 | 2.9284e-07 | 0.75555571 | 0.17614617 |
| 1740 | 1800 | 2.245107e-06 | 3.31023e-07 | 1.854654e-06 | 3.008646e-07 | 0.82608713 | 0.18109014 |
| 1800 | 1860 | 1.75704e-06 | 2.9284e-07 | 1.17136e-06 | 2.391029e-07 | 0.66666667 | 0.17568211 |
| 1860 | 1920 | 1.805847e-06 | 2.968794e-07 | 1.561814e-06 | 2.760922e-07 | 0.86486507 | 0.20878387 |
| 1920 | 1980 | 1.366587e-06 | 2.582606e-07 | 1.02494e-06 | 2.236603e-07 | 0.74999982 | 0.2165063 |
| 1980 | 2040 | 1.854654e-06 | 3.008646e-07 | 1.708234e-06 | 2.887442e-07 | 0.92105266 | 0.21578439 |
| 2040 | 2100 | 1.366587e-06 | 2.582606e-07 | 1.268974e-06 | 2.488662e-07 | 0.92857169 | 0.25289865 |
| 2100 | 2160 | 1.02494e-06 | 2.236603e-07 | 1.02494e-06 | 2.236603e-07 | 1 | 0.30860678 |
| 2160 | 2220 | 1.659427e-06 | 2.845894e-07 | 1.561814e-06 | 2.760922e-07 | 0.94117668 | 0.23180809 |
| 2220 | 2280 | 8.297135e-07 | 2.012351e-07 | 5.856801e-07 | 1.690713e-07 | 0.70588233 | 0.26614375 |
| 2280 | 2340 | 1.122554e-06 | 2.340686e-07 | 9.273268e-07 | 2.127434e-07 | 0.82608658 | 0.25609993 |
| 2340 | 2400 | 9.761335e-07 | 2.182701e-07 | 8.785201e-07 | 2.070692e-07 | 0.89999995 | 0.29240384 |
| 2400 | 2460 | 7.321001e-07 | 1.890274e-07 | 7.321001e-07 | 1.890274e-07 | 1 | 0.36514831 |
| 2460 | 2520 | 9.273268e-07 | 2.127434e-07 | 8.297135e-07 | 2.012351e-07 | 0.89473689 | 0.298707 |
| 2520 | 2580 | 2.440334e-07 | 1.09135e-07 | 2.440334e-07 | 1.09135e-07 | 1 | 0.63245522 |
| 2580 | 2640 | 4.392601e-07 | 1.4642e-07 | 4.392601e-07 | 1.4642e-07 | 1 | 0.47140441 |
| 2640 | 2700 | 8.785201e-07 | 2.070692e-07 | 8.785201e-07 | 2.070692e-07 | 1 | 0.33333338 |
| 2700 | 2760 | 2.9284e-07 | 1.195514e-07 | 2.9284e-07 | 1.195514e-07 | 1 | 0.57735013 |
| 2760 | 2820 | 7.321001e-07 | 1.890274e-07 | 6.832934e-07 | 1.826179e-07 | 0.9333333 | 0.34683758 |
| 2820 | 2880 | 4.392601e-07 | 1.4642e-07 | 4.392601e-07 | 1.4642e-07 | 1 | 0.47140441 |
| 2880 | 2940 | 3.904534e-07 | 1.380461e-07 | 3.904534e-07 | 1.380461e-07 | 1 | 0.49999992 |
| 2940 | 3000 | 3.904534e-07 | 1.380461e-07 | 3.904534e-07 | 1.380461e-07 | 1 | 0.49999992 |
| 3000 | 3060 | 4.392601e-07 | 1.4642e-07 | 3.416467e-07 | 1.291303e-07 | 0.77777768 | 0.39196304 |
| 3060 | 3120 | 2.440334e-07 | 1.09135e-07 | 1.952267e-07 | 9.761335e-08 | 0.79999992 | 0.53665614 |
| 3120 | 3180 | 2.440334e-07 | 1.09135e-07 | 1.952267e-07 | 9.761335e-08 | 0.79999992 | 0.53665614 |
| 3180 | 3240 | 2.9284e-07 | 1.195514e-07 | 2.9284e-07 | 1.195514e-07 | 1 | 0.57735013 |
| 3240 | 3300 | 2.440334e-07 | 1.09135e-07 | 2.440334e-07 | 1.09135e-07 | 1 | 0.63245522 |
| 3300 | 3360 | 4.392601e-07 | 1.4642e-07 | 4.392601e-07 | 1.4642e-07 | 1 | 0.47140441 |
| 3360 | 3420 | 0 | 0 | 0 | 0 | 0 | 0 |
| 3420 | 3480 | 2.9284e-07 | 1.195514e-07 | 2.9284e-07 | 1.195514e-07 | 1 | 0.57735013 |
| 3480 | 3540 | 9.761335e-08 | 6.902306e-08 | 9.761335e-08 | 6.902306e-08 | 1 | 0.99999998 |
| 3540 | 3600 | 2.9284e-07 | 1.195514e-07 | 2.9284e-07 | 1.195514e-07 | 1 | 0.57735013 |
| 3600 | 3660 | 4.880667e-08 | 4.880667e-08 | 4.880667e-08 | 4.880667e-08 | 1 | 1.4142136 |
| 3660 | 3720 | 1.4642e-07 | 8.453564e-08 | 9.761335e-08 | 6.902306e-08 | 0.66666678 | 0.60858075 |
| 3720 | 3780 | 9.761335e-08 | 6.902306e-08 | 9.761335e-08 | 6.902306e-08 | 1 | 0.99999998 |
| 3780 | 3840 | 9.761335e-08 | 6.902306e-08 | 9.761335e-08 | 6.902306e-08 | 1 | 0.99999998 |
| 3840 | 3900 | 0 | 0 | 0 | 0 | 0 | 0 |
| 3900 | 3960 | 2.440334e-07 | 1.09135e-07 | 2.440334e-07 | 1.09135e-07 | 1 | 0.63245522 |
| 3960 | 4020 | 9.761335e-08 | 6.902306e-08 | 9.761335e-08 | 6.902306e-08 | 1 | 0.99999998 |
| 4020 | 4080 | 4.880667e-08 | 4.880667e-08 | 4.880667e-08 | 4.880667e-08 | 1 | 1.4142136 |
| 4080 | 4140 | 1.952267e-07 | 9.761335e-08 | 1.4642e-07 | 8.453564e-08 | 0.74999987 | 0.57282192 |
| 4140 | 4200 | 9.761335e-08 | 6.902306e-08 | 9.761335e-08 | 6.902306e-08 | 1 | 0.99999998 |
| 4200 | 4260 | 1.4642e-07 | 8.453564e-08 | 1.4642e-07 | 8.453564e-08 | 1 | 0.81649671 |
| 4260 | 4320 | 9.761335e-08 | 6.902306e-08 | 9.761335e-08 | 6.902306e-08 | 1 | 0.99999998 |
| 4320 | 4380 | 4.880667e-08 | 4.880667e-08 | 0 | 0 | 0 | 0 |
| 4380 | 4440 | 4.880667e-08 | 4.880667e-08 | 4.880667e-08 | 4.880667e-08 | 1 | 1.4142136 |
| 4440 | 4500 | 1.4642e-07 | 8.453564e-08 | 1.4642e-07 | 8.453564e-08 | 1 | 0.81649671 |
| 4500 | 4560 | 1.4642e-07 | 8.453564e-08 | 1.4642e-07 | 8.453564e-08 | 1 | 0.81649671 |
| 4560 | 4620 | 0 | 0 | 0 | 0 | 0 | 0 |
| 4620 | 4680 | 0 | 0 | 0 | 0 | 0 | 0 |
| 4680 | 4740 | 0 | 0 | 0 | 0 | 0 | 0 |
| 4740 | 4800 | 1.4642e-07 | 8.453564e-08 | 1.4642e-07 | 8.453564e-08 | 1 | 0.81649671 |
| 4800 | 4860 | 9.761335e-08 | 6.902306e-08 | 9.761335e-08 | 6.902306e-08 | 1 | 0.99999998 |
| 4860 | 4920 | 0 | 0 | 0 | 0 | 0 | 0 |
| 4920 | 4980 | 4.880667e-08 | 4.880667e-08 | 4.880667e-08 | 4.880667e-08 | 1 | 1.4142136 |
| 4980 | 5040 | 4.880667e-08 | 4.880667e-08 | 4.880667e-08 | 4.880667e-08 | 1 | 1.4142136 |
Pair transverse momentum
Data and calculation details
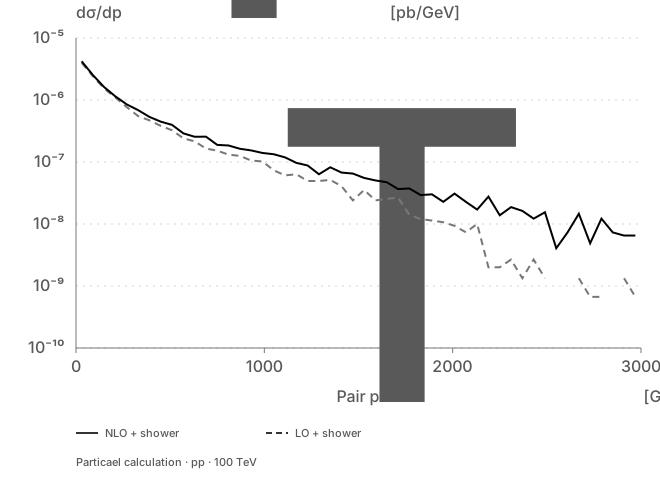
The pair transverse momentum after matching to a parton shower.
Matching a fixed-order calculation to a parton shower produces event-level predictions for radiation-sensitive observables. This example shows the transverse momentum of a particle pair.
The two curves compare LO and NLO calculations matched to Pythia 8, with the same collision energy and particle mass.
- Collision
- pp · 100 TeV
- Mass
- 1800 GeV
- CT18NNLO
- Shower
- Pythia 8
The bin edges and central differential cross sections are retained in the data table. The scale prescription is the pair invariant mass. Non-positive bins are not connected on the logarithmic axis. No scale or PDF band is drawn in this view.
Particael calculation
| pT centre [GeV] | Bin min [GeV] | Bin max [GeV] | LO+PS [pb/GeV] | NLO+PS [pb/GeV] |
|---|---|---|---|---|
| 30 | 0 | 60 | 3.97163e-06 | 4.2120167e-06 |
| 90 | 60 | 120 | 2.4114183e-06 | 2.5176117e-06 |
| 150 | 120 | 180 | 1.5274983e-06 | 1.6073665e-06 |
| 210 | 180 | 240 | 1.0915472e-06 | 1.138009e-06 |
| 270 | 240 | 300 | 7.6508433e-07 | 8.4679583e-07 |
| 330 | 300 | 360 | 5.494455e-07 | 6.8573383e-07 |
| 390 | 360 | 420 | 4.699995e-07 | 5.3361967e-07 |
| 450 | 420 | 480 | 3.8187467e-07 | 4.473945e-07 |
| 510 | 480 | 540 | 3.251275e-07 | 3.96961e-07 |
| 570 | 540 | 600 | 2.4100833e-07 | 2.8958633e-07 |
| 630 | 600 | 660 | 2.1497133e-07 | 2.5542167e-07 |
| 690 | 660 | 720 | 1.649004e-07 | 2.56235e-07 |
| 750 | 720 | 780 | 1.5221575e-07 | 1.8871917e-07 |
| 810 | 780 | 840 | 1.3151975e-07 | 1.84652e-07 |
| 870 | 840 | 900 | 1.2551123e-07 | 1.6350237e-07 |
| 930 | 900 | 960 | 1.0548285e-07 | 1.5374103e-07 |
| 990 | 960 | 1020 | 1.0214478e-07 | 1.3991247e-07 |
| 1050 | 1020 | 1080 | 7.3437417e-08 | 1.3340492e-07 |
| 1110 | 1080 | 1140 | 6.0752783e-08 | 1.1876292e-07 |
| 1170 | 1140 | 1200 | 6.3423233e-08 | 9.67999e-08 |
| 1230 | 1200 | 1260 | 4.940335e-08 | 8.7852017e-08 |
| 1290 | 1260 | 1320 | 4.940335e-08 | 6.3448683e-08 |
| 1350 | 1320 | 1380 | 5.14062e-08 | 8.21579e-08 |
| 1410 | 1380 | 1440 | 4.0724383e-08 | 6.75159e-08 |
| 1470 | 1440 | 1500 | 2.4034067e-08 | 6.5075567e-08 |
| 1530 | 1500 | 1560 | 3.5383483e-08 | 5.5314233e-08 |
| 1590 | 1560 | 1620 | 2.4034067e-08 | 5.0433567e-08 |
| 1650 | 1620 | 1680 | 2.5369283e-08 | 4.7179783e-08 |
| 1710 | 1680 | 1740 | 2.6704517e-08 | 3.6605e-08 |
| 1770 | 1740 | 1800 | 1.4019872e-08 | 3.741845e-08 |
| 1830 | 1800 | 1860 | 1.2017033e-08 | 2.9284e-08 |
| 1890 | 1860 | 1920 | 1.134942e-08 | 3.009745e-08 |
| 1950 | 1920 | 1980 | 1.0681807e-08 | 2.277645e-08 |
| 2010 | 1980 | 2040 | 9.3465817e-09 | 3.09109e-08 |
| 2070 | 2040 | 2100 | 7.3437417e-09 | 2.277645e-08 |
| 2130 | 2100 | 2160 | 1.0014193e-08 | 1.7082333e-08 |
| 2190 | 2160 | 2220 | 2.0028383e-09 | 2.7657117e-08 |
| 2250 | 2220 | 2280 | 2.0028383e-09 | 1.3828558e-08 |
| 2310 | 2280 | 2340 | 2.6704517e-09 | 1.8709233e-08 |
| 2370 | 2340 | 2400 | 1.3352258e-09 | 1.6268892e-08 |
| 2430 | 2400 | 2460 | 2.6704517e-09 | 1.2201668e-08 |
| 2490 | 2460 | 2520 | 1.3352258e-09 | 1.5455447e-08 |
| 2550 | 2520 | 2580 | 0 | 4.0672233e-09 |
| 2610 | 2580 | 2640 | 0 | 7.3210017e-09 |
| 2670 | 2640 | 2700 | 1.3352258e-09 | 1.4642002e-08 |
| 2730 | 2700 | 2760 | 6.67613e-10 | 4.8806667e-09 |
| 2790 | 2760 | 2820 | 6.67613e-10 | 1.2201668e-08 |
| 2850 | 2820 | 2880 | 0 | 7.3210017e-09 |
| 2910 | 2880 | 2940 | 1.3352258e-09 | 6.5075567e-09 |
| 2970 | 2940 | 3000 | 6.67613e-10 | 6.5075567e-09 |
Calculation method
aNNLO+NNLL
Threshold resummation
Invariant-mass spectrum
Data and calculation details
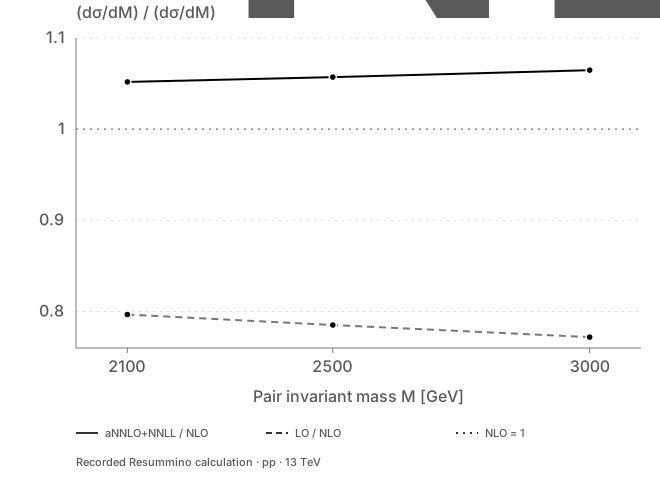
The invariant mass of the pair fixes the observable and central scale in this recorded Resummino calculation. Dividing by the NLO result makes the relative correction visible.
The aNNLO+NNLL central prediction is 5.2% above NLO at M = 2100 GeV and 6.5% above it at M = 3000 GeV. The three markers are the recorded calculation points.
- Collision
- pp · 13 TeV
- Mass
- 1000 GeV
- PDF4LHC21_40
- Scales
- μR = μF = M
Recorded invariant-mass calculations at M = 2100, 2500 and 3000 GeV. The table contains the original differential cross sections in pb/GeV before normalisation. The central scale is the pair invariant mass M. These values are distinct from the published total-rate benchmark.
Recorded Resummino calculation
| M [GeV] | LO [pb/GeV] | NLO [pb/GeV] | aNNLO+NNLL [pb/GeV] |
|---|---|---|---|
| 2100 | 7.2370748e-07 | 9.0836255e-07 | 9.5543134e-07 |
| 2500 | 3.88813e-07 | 4.9517922e-07 | 5.2344687e-07 |
| 3000 | 1.1288432e-07 | 1.4623819e-07 | 1.556987e-07 |
Published cross sections
Data and calculation details
This published electroweak pair-production benchmark combines approximate NNLO QCD with next-to-next-to-leading logarithmic threshold resummation.
The shaded region follows the printed scale variations. PDF uncertainties are listed separately in the data table and are not included in this band.
- Origin
- Published reference
- Mass range
- 200–1500 GeV
- PDF4LHC21_40
- Scales
- μR = μF = m
The data come from the charged-pair column in the upper, 13 TeV block of Table 6: 14 rows covering masses from 200 to 1500 GeV. Central values are converted from fb to pb, and the quoted percentages determine the scale-band limits. PDF percentages are kept separately.
Redrawn from Fiaschi et al., EPJC 83 (2023) 707, Table 6. CC BY 4.0. Central values and scale variations are transcribed from the printed table; layout and typography are adapted.
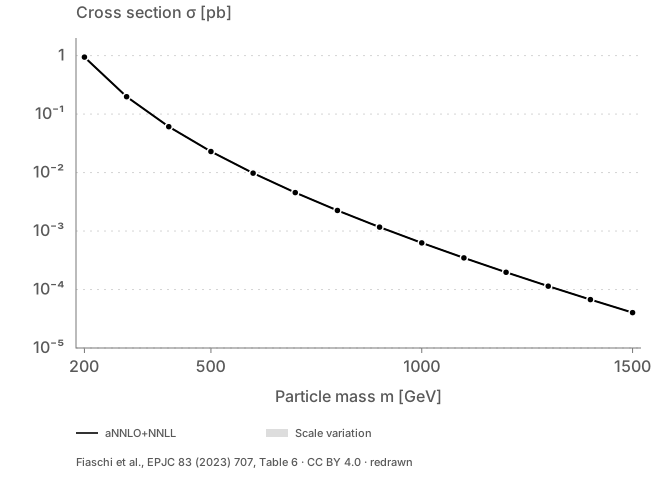
| Mass [GeV] | aNNLO+NNLL [pb] | Scale min [pb] | Scale max [pb] | PDF down [%] | PDF up [%] |
|---|---|---|---|---|---|
| 200 | 0.9419 | 0.9305972 | 0.951319 | -3.3 | 3.3 |
| 300 | 0.1982 | 0.1968126 | 0.1995874 | -4.1 | 4.1 |
| 400 | 0.06087 | 0.06056565 | 0.06117435 | -4.9 | 4.9 |
| 500 | 0.02289 | 0.02279844 | 0.02298156 | -5.8 | 5.8 |
| 600 | 0.009769 | 0.009739693 | 0.009808076 | -6.9 | 6.9 |
| 700 | 0.004543 | 0.004533914 | 0.004556629 | -8.1 | 8.1 |
| 800 | 0.002248 | 0.002243504 | 0.002256992 | -9.5 | 9.5 |
| 900 | 0.001166 | 0.001163668 | 0.001169498 | -11.4 | 11.4 |
| 1000 | 0.0006272 | 0.0006265728 | 0.0006290816 | -13.8 | 13.8 |
| 1100 | 0.0003474 | 0.0003470526 | 0.0003484422 | -16.9 | 16.9 |
| 1200 | 0.0001971 | 0.0001969029 | 0.0001976913 | -20.9 | 20.9 |
| 1300 | 0.0001141 | 0.0001139859 | 0.0001144423 | -25.8 | 25.8 |
| 1400 | 6.724e-05 | 6.717276e-05 | 6.744172e-05 | -31.9 | 31.9 |
| 1500 | 4.025e-05 | 4.020975e-05 | 4.03305e-05 | -39.4 | 39.4 |
These examples use different setups. They should not be read as successive orders of the same calculation. Methods and sources →
Physics models
Browse models by research area. The methods available depend on the process you choose.
350 physics models
Leptons
Neutrinos
Gauge interactions
Dark matter
Effective field theories
Quarks
Research workflow
Keep the steps of your research together, from the initial settings to a project you can return to.
Configuration
Start with a process, a model or a setup from the literature.
Calculation
Inspect and edit the MG5 script and inputs, then follow the calculation in the terminal.
Project record
Return to the project or export it with its settings and outputs.
Features in development · Development notes
Research principles
Trace a result to its inputs
Return to the process definition, input files and analysis settings as you examine the numerical results.
Calculated quantities
Read the results alongside their units, bin definitions and uncertainty methods.
Published reference points
Compare processes and settings on a like-for-like basis, with numerical and theoretical uncertainties stated alongside the results.
Questions and answers
A closer look at the calculations, the figures and access to Particael.
What does Particael calculate?
Particael brings cross sections, differential distributions and parameter studies into a macOS application. LO, NLO QCD, parton-shower matching and threshold resummation apply to compatible processes.
What are the steps in a calculation?
The version under development lets you begin with a process, a model or a setup from the literature. From there, you can edit the MG5 script and follow the calculation in the integrated terminal. You can also reopen or export your project, with the inputs and settings for each process still available.
What does a shaded band represent?
Each figure explains how its uncertainties are defined. Scale variation, PDF uncertainty and Monte Carlo integration error describe different effects. A scale envelope is not a statistical confidence interval.
Can I see how a result was calculated?
Open “Data and calculation details” below a figure for its values, settings, source and downloadable CSV and SVG files. Changing between 3D and 2D preserves the recorded main-panel values. The native histogram also includes diagnostics in 2D.
Which research areas does Particael cover?
The model library covers leptons, neutrinos, gauge interactions, dark matter, effective field theories and quarks. The calculation methods available depend on the process you choose.
Which computers can run Particael?
Particael is being developed for Mac computers with Apple silicon. Each invited build comes with its own requirements and access instructions.
How can I hear about availability?
Particael is still in development. Release emails let you know about availability and new versions; they do not grant access to an invited build.
Is Particael affiliated with the software it uses?
Particael is independent of MadGraph5_aMC@NLO, Pythia 8, LHAPDF, Resummino and the other projects used in its workflows. Their software and publications remain the work of their authors.
Acknowledgements
We thank the researchers behind the physics models and publications, and the developers of MadGraph5_aMC@NLO, Pythia 8, LHAPDF, Resummino and the other open-source tools used in these workflows. You can find the full references in the application under Settings › About. This acknowledgement does not imply endorsement or affiliation.